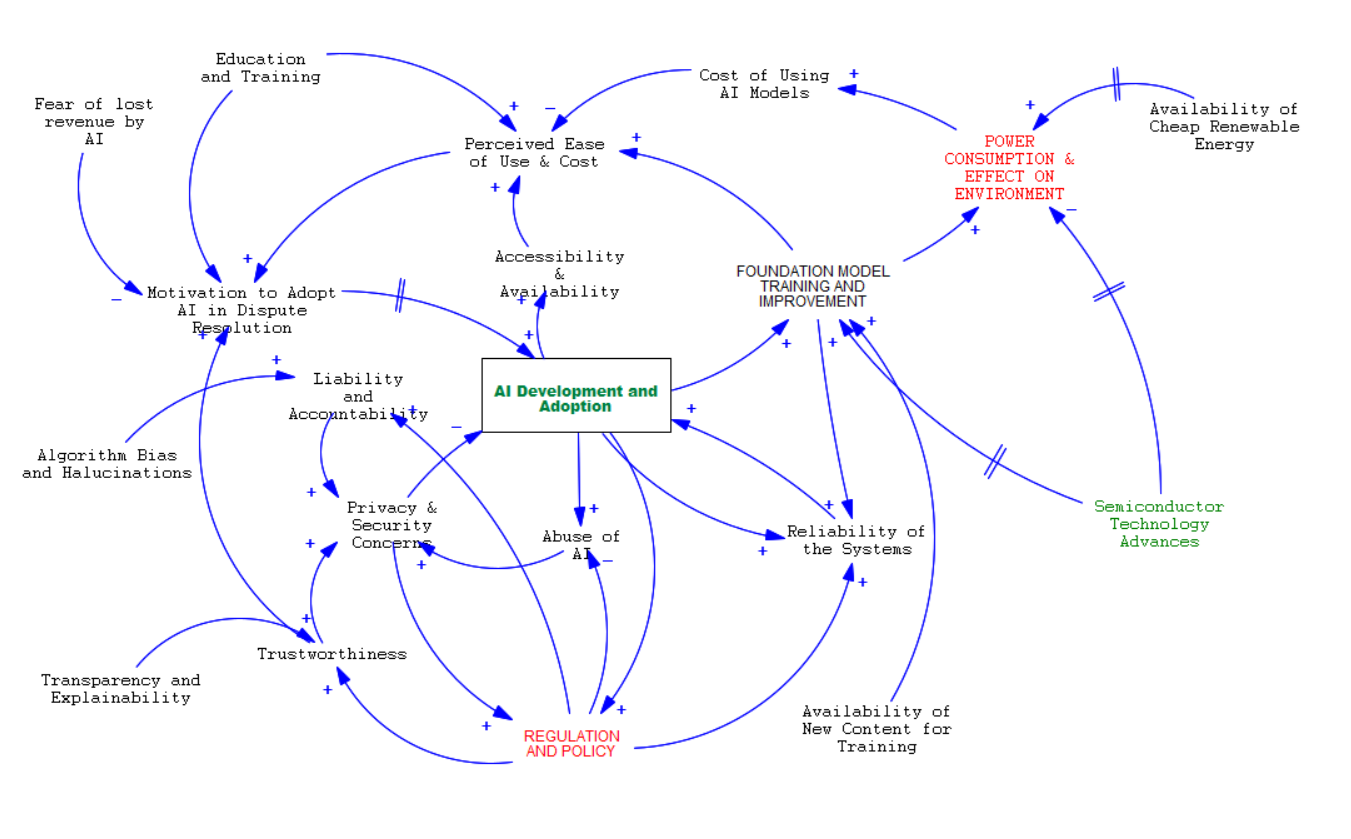
R · Adoption / trust reinforcing
B1 · Regulation / liability balancing
B2 · Cost / power balancing
D · External drivers
20 variables, 36 causal links, four feedback loops. Hover an arrow to highlight it; double-bars (‖) on an arrow indicate a delay.
View original Stella® diagram
Original Stella® model — Bob Bergman, AZ Decision Science.