A system-dynamics view of US illegal immigration. Rather than a single cause, the diagram shows the interlocking feedback loops that keep the system in motion — labor demand from US business hiring, wage differentials between rural Mexico and US illegal wages, enforcement pressure, and the rural Mexican economic investment that follows migrant remittances back home.
23 variables, 32 causal links, four feedback loops. Hover an arrow to highlight it; double-bars (‖) on an arrow indicate a delay.
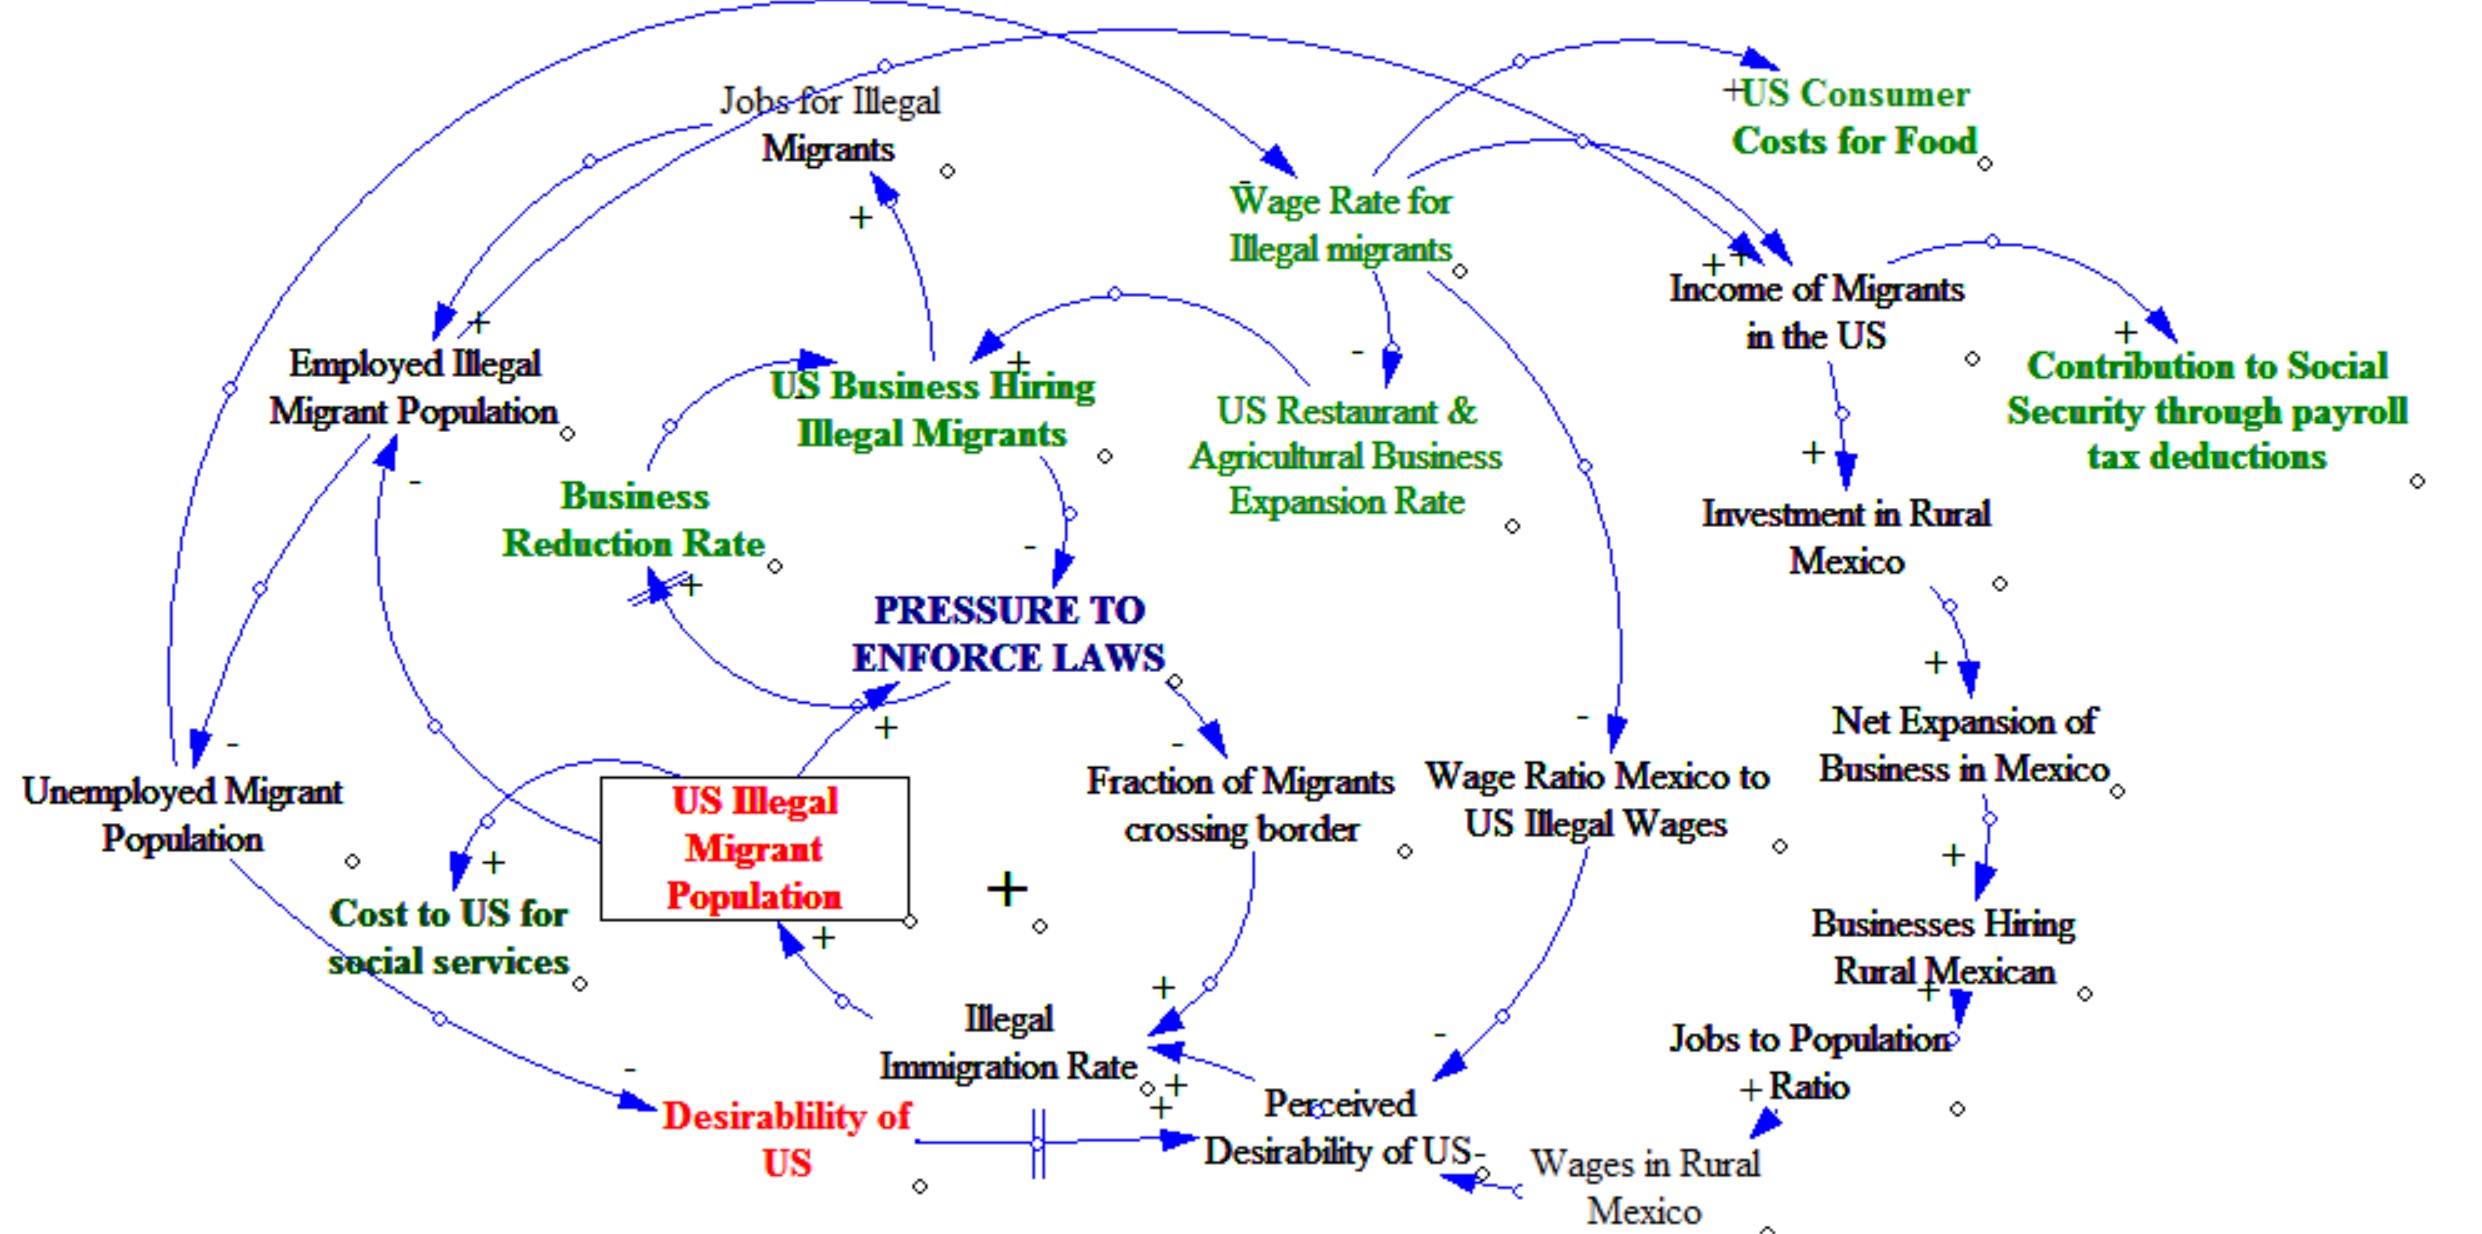
Original Stella® model — Bob Bergman, AZ Decision Science.
Each arrow shows the direction of causal influence. A + means the variables move in the same direction (more of one produces more of the other); a − means they move in opposite directions. Loops formed by these arrows are either reinforcing (amplify behavior) or balancing (push toward equilibrium). The double-bar marks indicate a delay.
Policy interventions that target only one variable — enforcement alone, or wage rules alone — typically produce policy resistance from the other loops. A causal loop diagram makes the structure of the resistance visible before the policy is implemented, so stakeholders can debate the system, not just the symptom.
This is the kind of diagram we build during a system-dynamics modeling engagement — usually as the first step before turning the structure into a runnable Stella® simulation.
Capacity loops, growth dynamics, policy resistance, customer churn, hiring & burnout — if it has feedback, we can model it.